dynamicalab.drawing.group_radial_layout
-
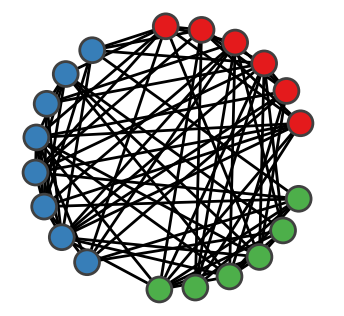
dynamicalab.drawing.group_radial_layout(G, groups, radius=1, margin=0.3141592653589793, phase=0.0, dx=0.0, dy=0.0)[source]¶ This constructs a circular layout of nodes with groups. Each group is separated by a certain angle.
Parameters
- G : Networkx Graph
- A Networkx
GraphorDiGraph. - groups : list of lists
- A list of groups of nodes. Each element of groups must be a list of
node_id. - radius : float : (default=1)
- Radius of the circle. Could be useful if you plan to plot two graphs of different size on the same figure.
- margin : float : (default=np.pi/10)
- Angle space between groups. Increase to add space between groups.
- phase : float : (default=0.0)
- Initial phase of the circle. This mostly induce a rotation of the nodes on the circle.
- dx : float : (default=0.0)
- X translation of nodes.
- dy : float : (default=0.0)
- Y translation of nodes.
Returns
- dict
- Dictionary of positions that can be use directly with
draw_networks. Each key is anode_id(fromgroups) and the value is a position[x,y].
{
    0 : [-0.5,0.1],
    1 : [-0.1, 0.5],
    ...
}
Raise
ValueError- Occurs if
groupsdoes not contain all nodes (low criterion).
Example
import networkx as nx
import dynamicalab.drawing as draw
import matplotlib.pyplot as plt
import seaborn as sns

# Generate network
N = 20
G = nx.erdos_renyi_graph(N,0.4)

sns.set(style="ticks")
fig = plt.figure(figsize=(2,2))
ax = plt.gca()

# Divide in three groups
groups = [range(6), range(6,14), range(14,N)]
pos = draw.group_radial_layout(G, groups)

node_colors = ['#e41a1c']*6+['#377eb8']*8+['#4daf4a']*(N-14)
draw.draw_networks(G, pos, ax,
                  mu=0.00,
                  arrow_scale=0.0,
                  edge_color="black",
                  node_color=node_colors,
                  use_edge_weigth=False)