dynamicalab.drawing.draw_networks
-
dynamicalab.drawing.draw_networks(G, pos, ax, mu=0.08, edge_color='black', edge_width=1.0, edge_alpha=1.0, use_edge_weigth=False, node_width=1.0, node_size=80.0, node_border_color='#404040', node_color='#EDEDED', node_alpha=1.0, arrow_scale=20.0, loop_radius=0.0, letter='', letter_fontsize=13, letter_pos=[0.87, 0.02], letter_color='black')[source]¶ This function draws networks.
Parameters
- G : Networkx Graph
- A Networkx
GraphorDiGraph. - pos : dict
- A dictionary of nodes positions.
- ax : Matplotlib Axes object
- Draw the network in the specified Matplotlib axes.
- mu : float : (default=0.05)
- Level of curvature. Should always be positive. If zero, then edges are straight.
- edge_color : str or list : (default=”black”)
- If a list, then each entry matches the color of the edge. when iterated through
edges. If a string, then each edge will have the same color. - edge_width : float or list : (default=1.0)
- Use this if
use_edge_weigth==Falsefor edge widths. If a list, each element must be in the same order asG.edges() - edge_alpha : float : (default=1)
- Edges opacity.
- use_edge_weigth : Bool : (default=False)
- Use the key
weightof the edges attributes to choose the thickness of the edges. - node_width : Float : (default=1.0)
- Node border width.
- node_size : Float : (default=80)
- Controls the node size (proportional to its radius).
- node_border_color : String : (default=”#404040”)
- Node border color.
- node_color : String or list : (default=”#EDEDED”)
- Node background color.
- node_alpha : float : (default=1.0)
- Node opacity.
- arrow_scale : float : (default=20)
- Control the size of the arrows. If equals to zero, then the arrows are invisible.
- loop_radius : float : (default=0)
- If
edgescontains self-loops, i.e.edge==(nodeA, nodeA), then it draws a self-loop which is composed of a simple circle. The radius of the circle is controlled byloop_radius. - letter : string : (default=”“)
- Text that can be positioned on the figure.
- letter_fontsize : float : (default=13)
- Font size of the text .
- letter_pos : List : (default=[0.87,0.02])
- Position of the text given in relative size of the plot. The first element is
x, the second isy. - letter_color : String : (default=”black”)
- Color of the text.
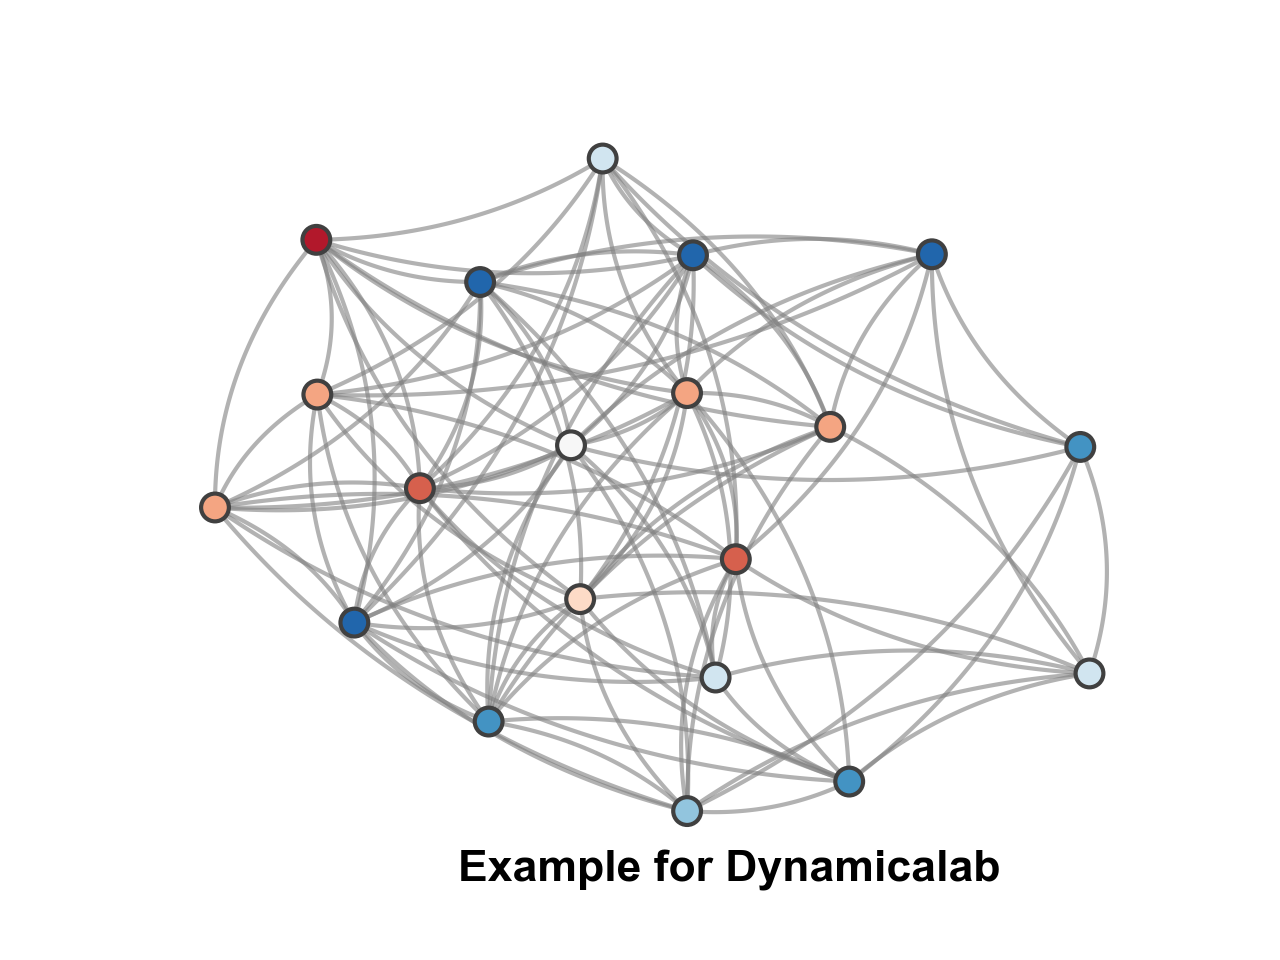
Example
import networkx as nx
import dynamicalab.drawing as draw
import matplotlib.pyplot as plt
import seaborn as sns
import numpy as np


G = nx.erdos_renyi_graph(20,0.5)
pos = nx.spring_layout(G)
edges = G.edges()

sns.set(style="ticks")
fig = plt.figure()
ax = plt.gca()

node_colors = np.random.choice(['#b2182b','#d6604d','#f4a582','#fddbc7','#f7f7f7','#d1e5f0','#92c5de','#4393c3','#2166ac'],  20, replace=True)

draw.draw_networks(G, pos, ax,
                        mu=0.08,
                        edge_color="gray",
                        edge_width=1.5,
                        edge_alpha=0.6,
                        use_edge_weigth=False,
                        node_width=1.5,
                        node_size=100.0,
                        node_border_color="#404040",
                        node_color=node_colors,
                        node_alpha=1.0,
                        arrow_scale=0.0,
                        loop_radius=0,
                        letter="Example for Dynamicalab",
                        letter_fontsize=16,
                        letter_pos=[0.3, -0.05],
                        letter_color="black")